DIY Planted Aquarium CO2 Reactor with Color Sensor Feedback
Build an automated planted aquarium CO2 injection system with Zigbee solenoid control, Raspberry Pi scheduling, and TCS34725 color sensor feedback using Krill's node-based IoT platform.
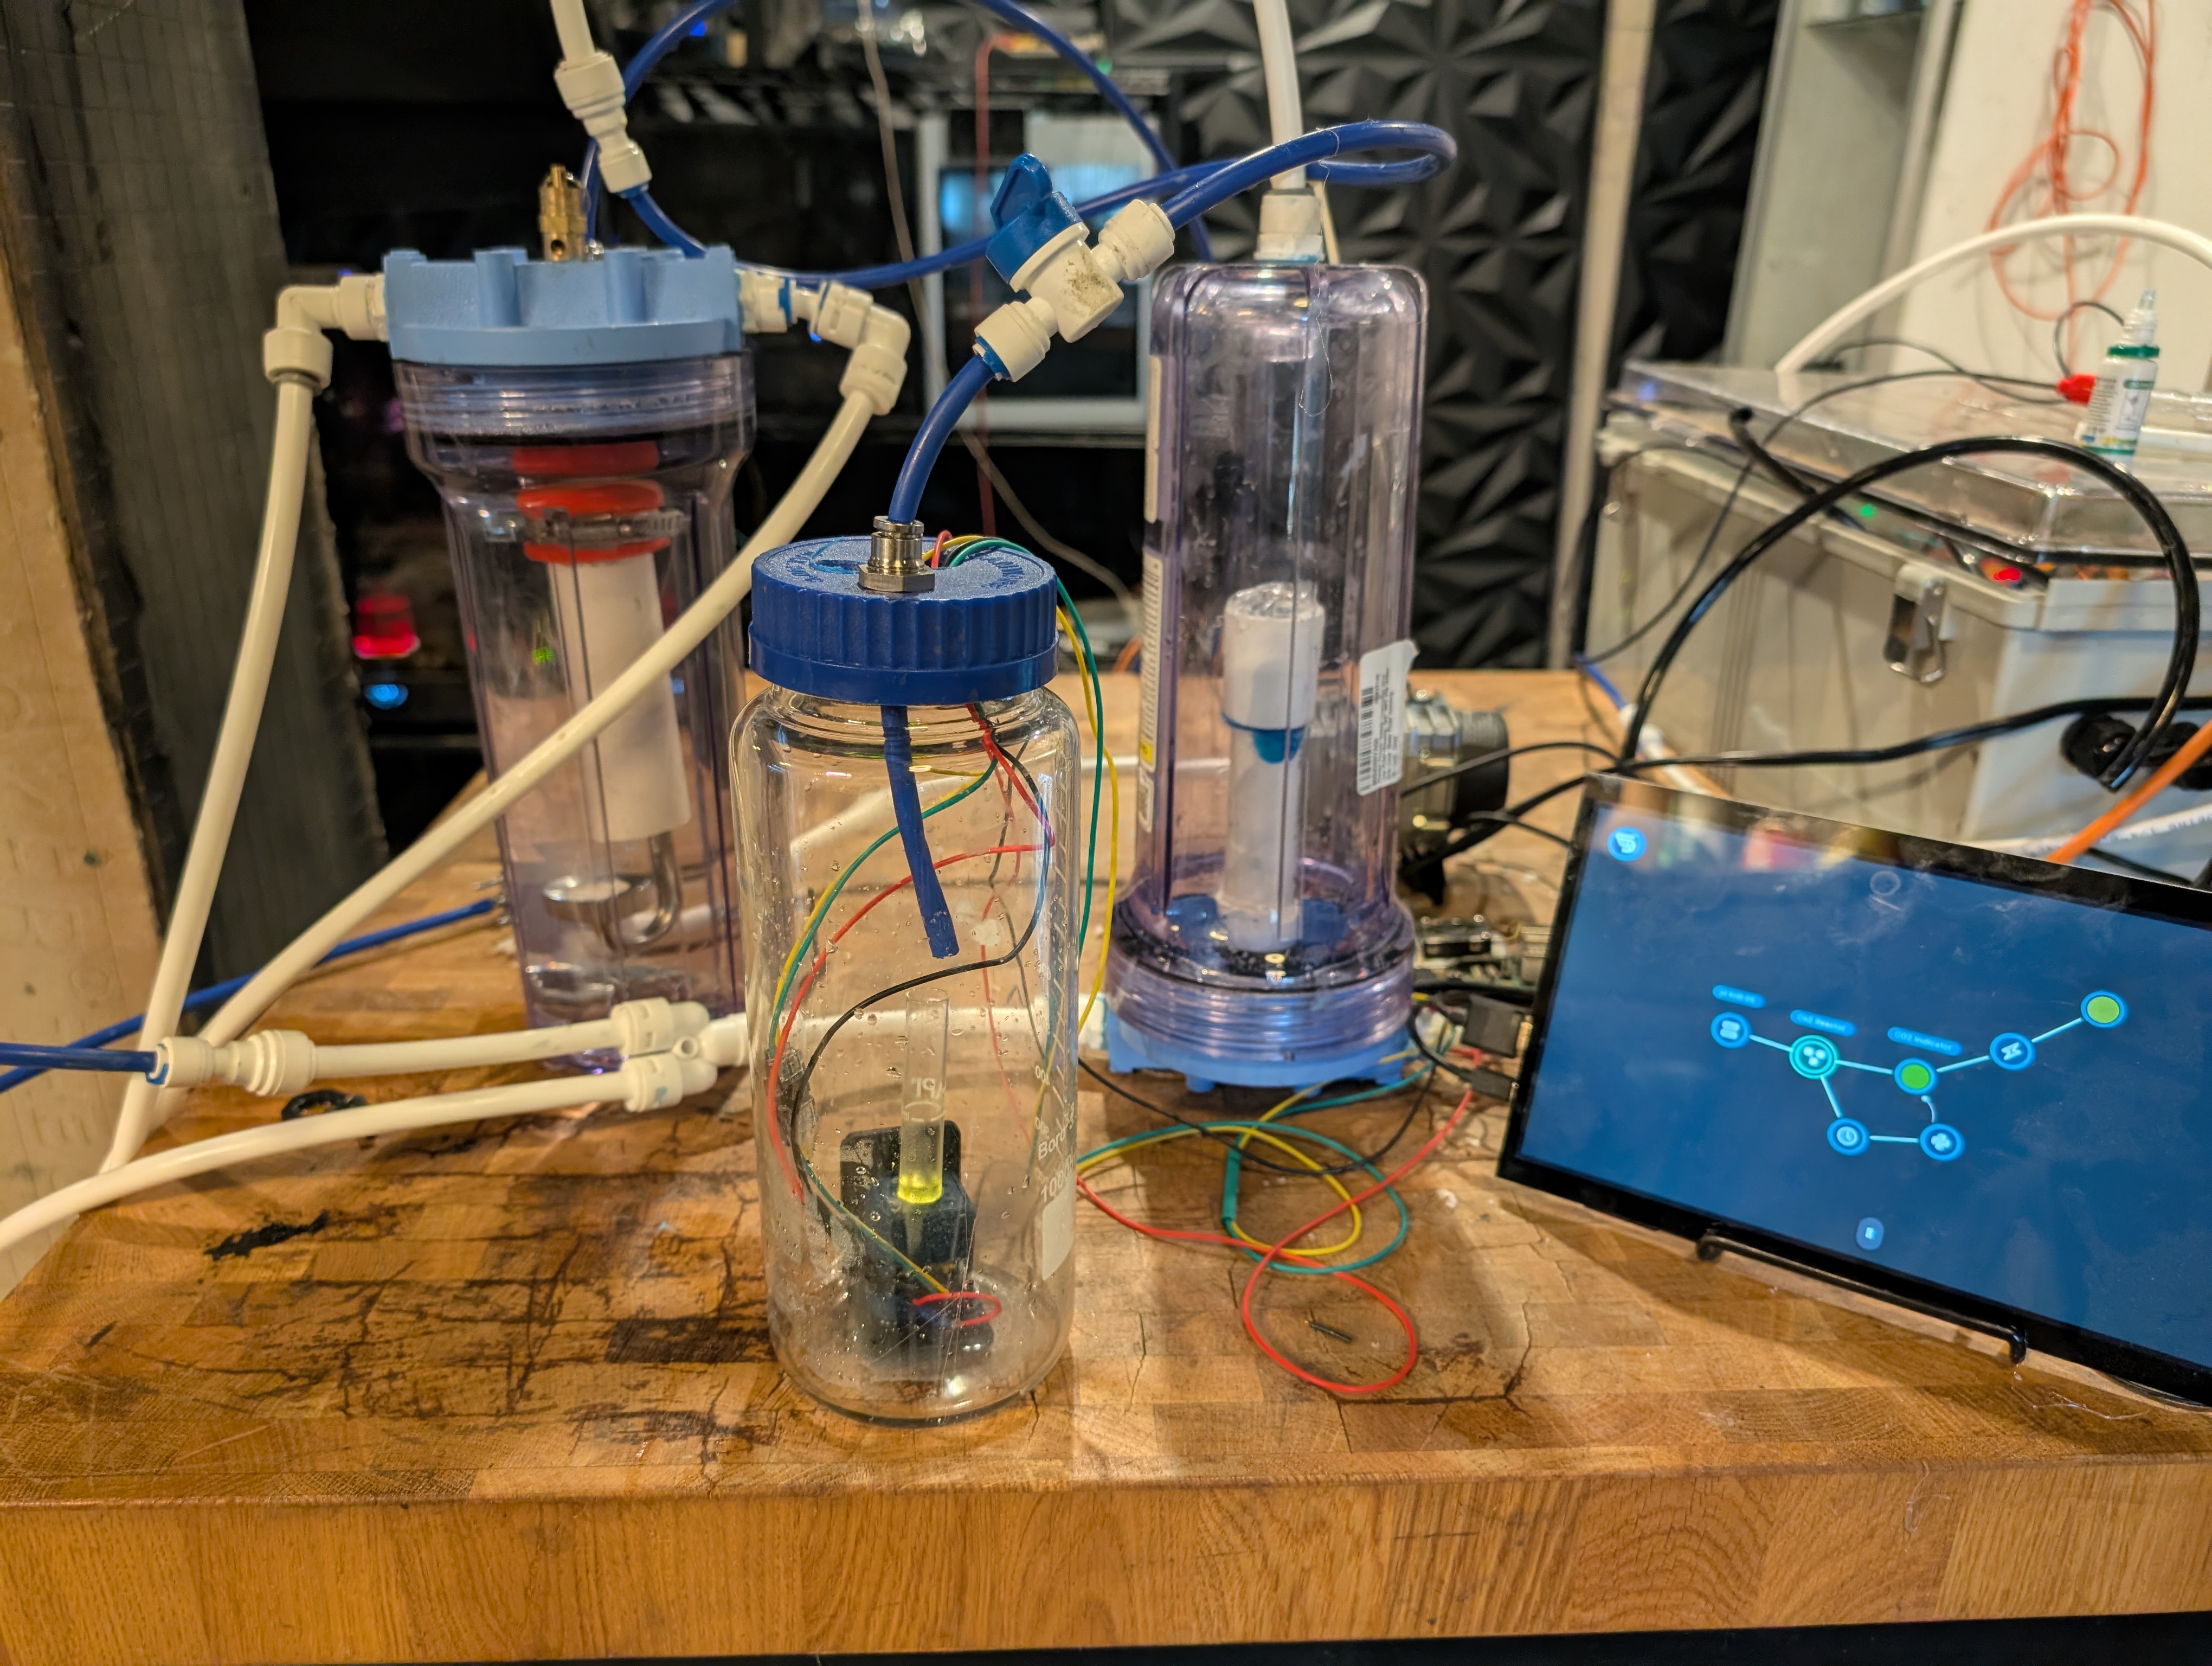
Planted Aquarium CO2 Reactor with Color Sensor Alerts
Shown here is the final reactor connected to a Raspberry Pi showing the node graph on a touchscreen with Krill Server configured in Kiosk Mode.
In this guide, we'll start with a simple setup that uses Zigbee-controlled solenoid valves to inject CO2 on a schedule, and then we'll add a TCS34725 color sensor to monitor CO2 levels in real time and trigger alerts if they get too high.
This project is a great way to learn about controlling solenoids, reading sensors with CircuitPython, and using Krill's logic gates and triggers for automation. Plus, it's super rewarding to see your plants thrive with the right amount of CO2!
⚠️ CRITICAL: For educational purposes only! This post is about my aquarium automation projects and comes with risk of leaks, floods, damage to devices, and even explosions from working with pressurized gas.
⚠️ CRITICAL: Too much CO2 can kill your fish! Always monitor your aquarium closely when experimenting with CO2 injection. Research the specific needs of your plants and fish, and consider consulting with an experienced aquarist before getting started. Always have a backup plan to quickly remove CO2 if levels get too high, such as an air pump or water change.
Before you start, make sure to install Krill Server and set up CircuitPython, as well as enable I2C on your Raspberry Pi to use the TCS34725 color sensor (or similar). You can follow the instructions in the Sensor Setup Guide.
Stage 1: Basic CO2 Injection with Solenoid and Zigbee Control
Node Types Used:
Parts:
- A server running an MQTT broker and Zigbee2MQTT (e.g., a Raspberry Pi with a Zigbee USB stick). (Tutorial)
- A Zigbee USB stick compatible with the above: Sonoff Zigbee Bridge, Conbee II, or similar.
- Two compatible Zigbee CO2 solenoid valves. I used these.
- A CO2 source (e.g., a DIY yeast fermentation setup, a pressurized CO2 tank with regulator, or a commercial CO2 generator).
- CO2-resistant tubing to connect the CO2 source to the solenoid valve and then to the aquarium.
- A regulator with a bubble counter to control the flow of CO2 and monitor injection rates.
- A CO2 check valve to prevent water from flowing back into your CO2 source. [Link]
- A diffuser to disperse the CO2 into the water. [Link]
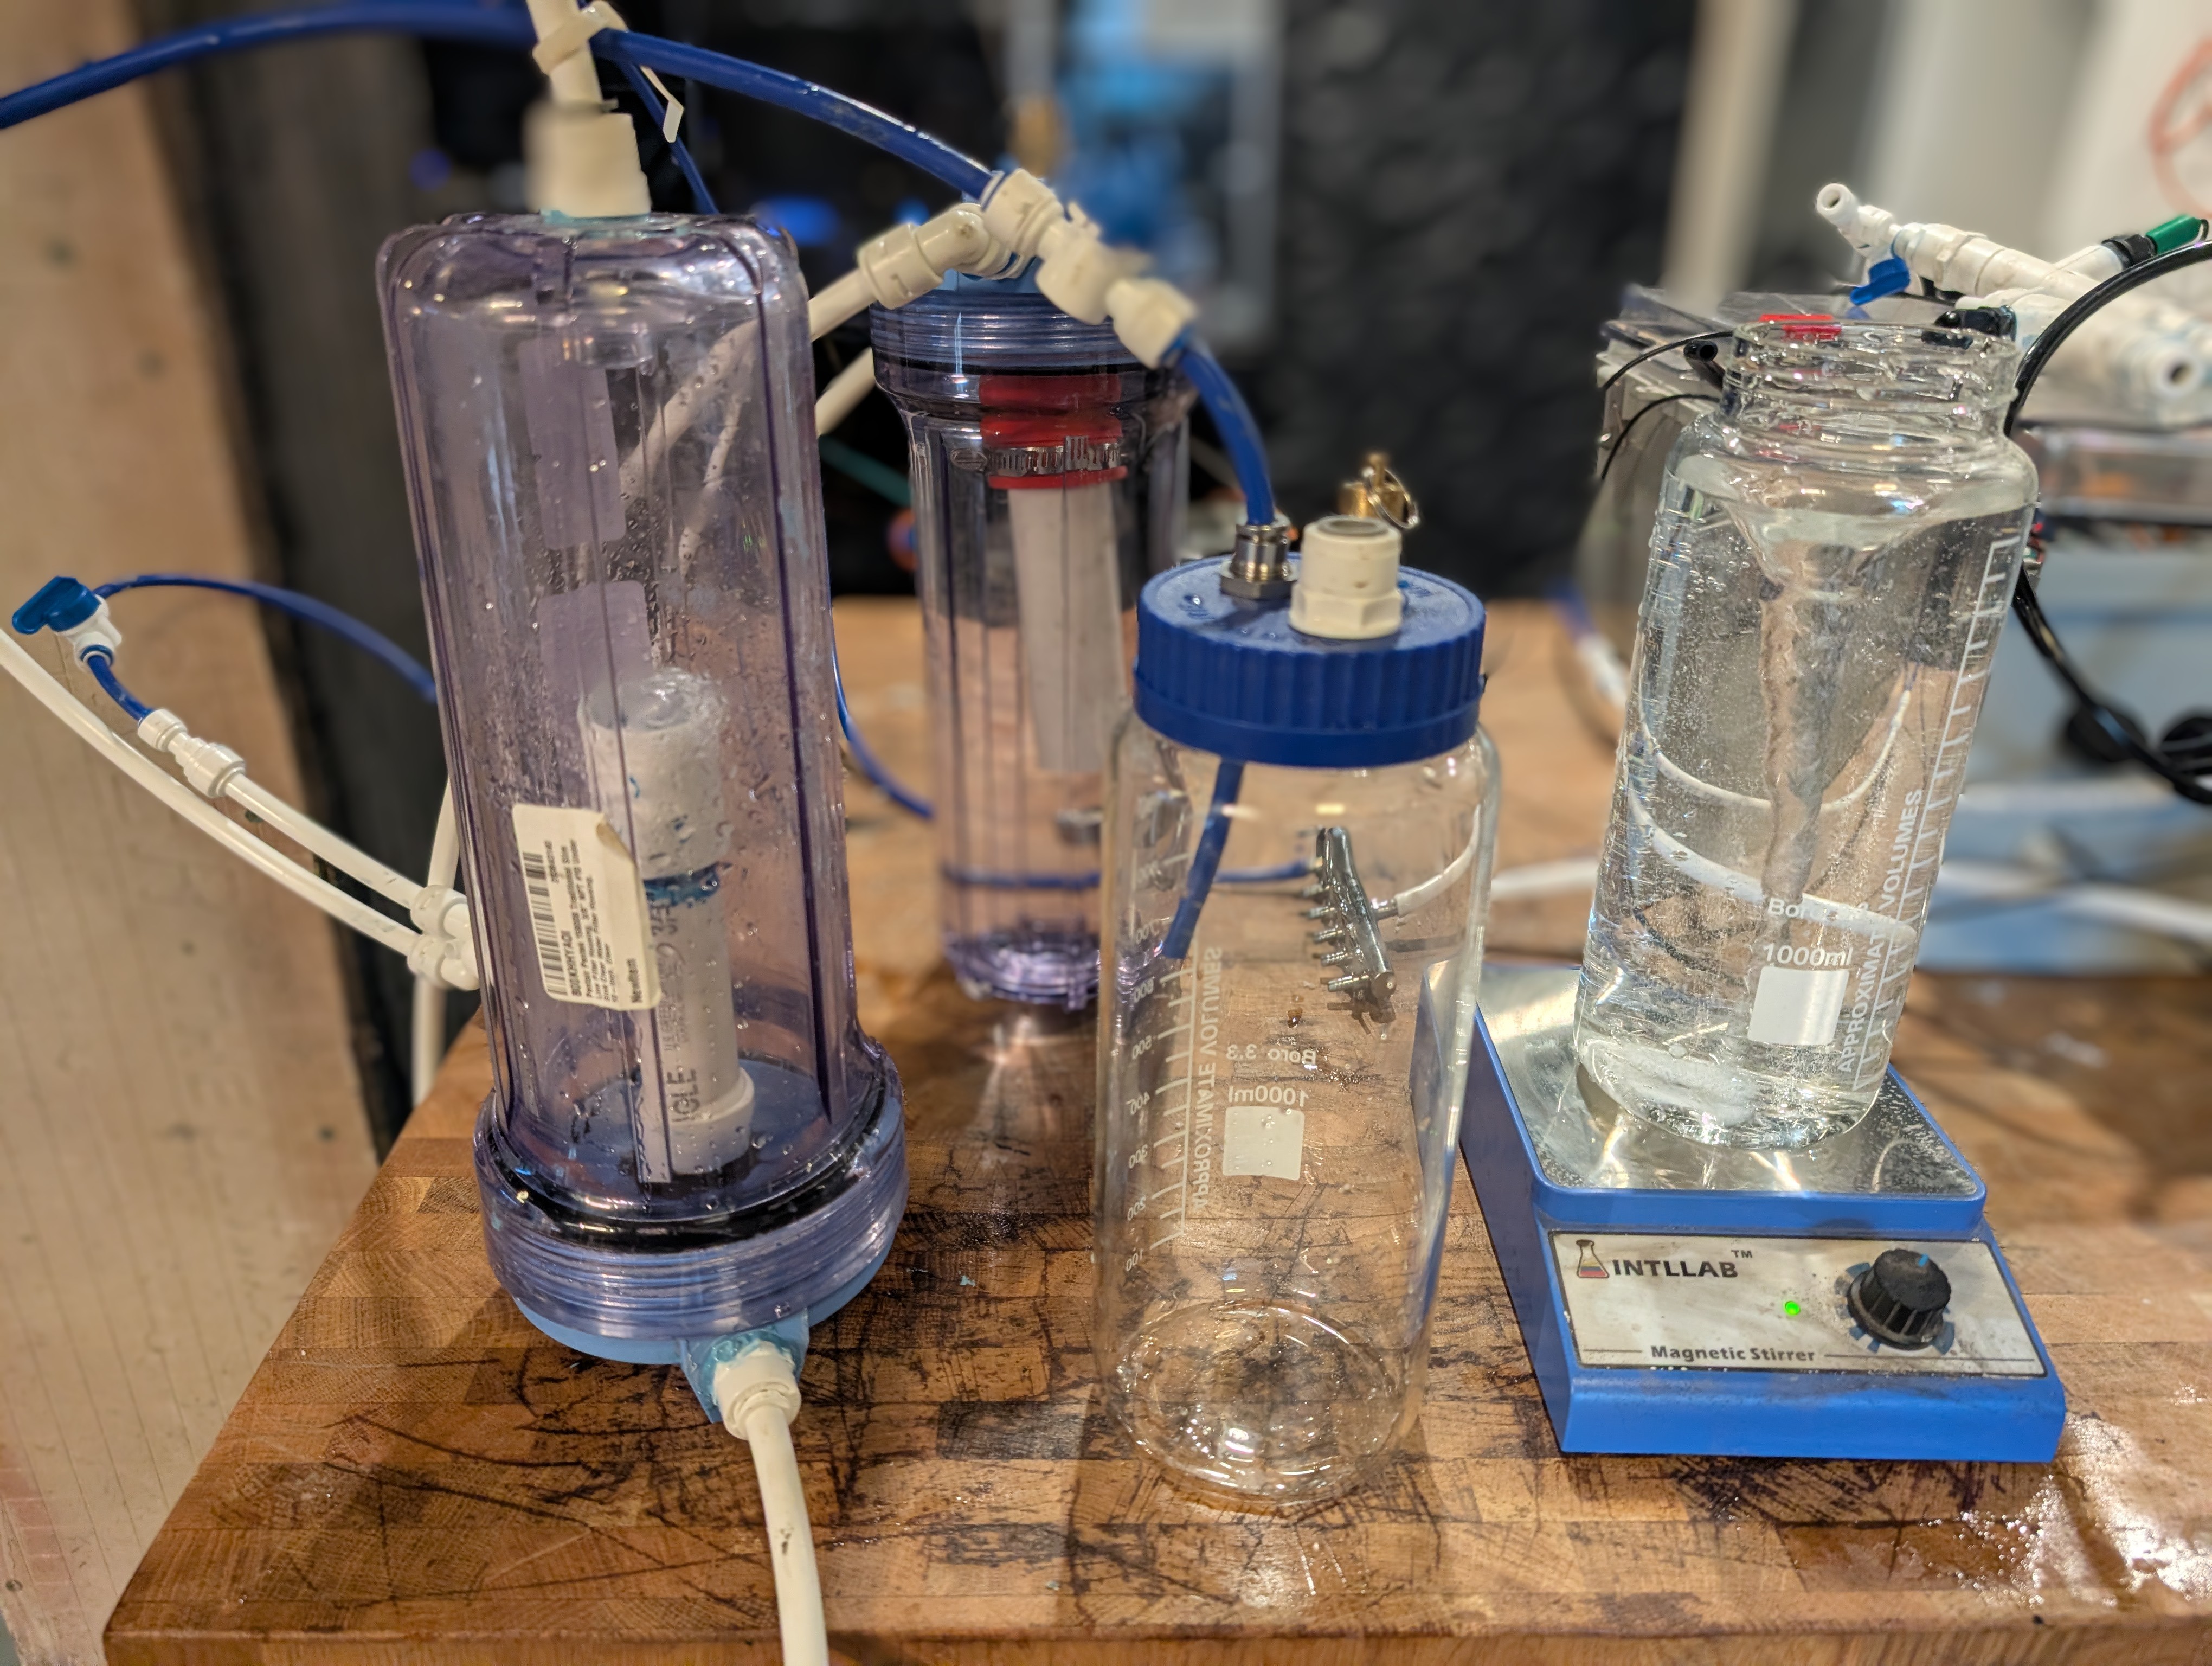
- I love to hack these Reverse Osmosis (RO) filters and use the canisters as DIY reactors. Just skip the filter and let water flow through a piece of PVC pipe.
- A low-pressure water pump to draw water from the aquarium into the reactor. I used a small 12V DC pump like this one.
You can use Propylene Glycol in the bubble counter of your CO2 regulator. It’s safe, prevents algae, and doesn’t evaporate as quickly as water, so you can easily see the bubbles and monitor your CO2 injection rate without needing to refill it often.
There is a wealth of connectors, valves, tubing, and devices for RO water systems that I use heavily in this project. You can find most of these parts at your local hardware store or online.
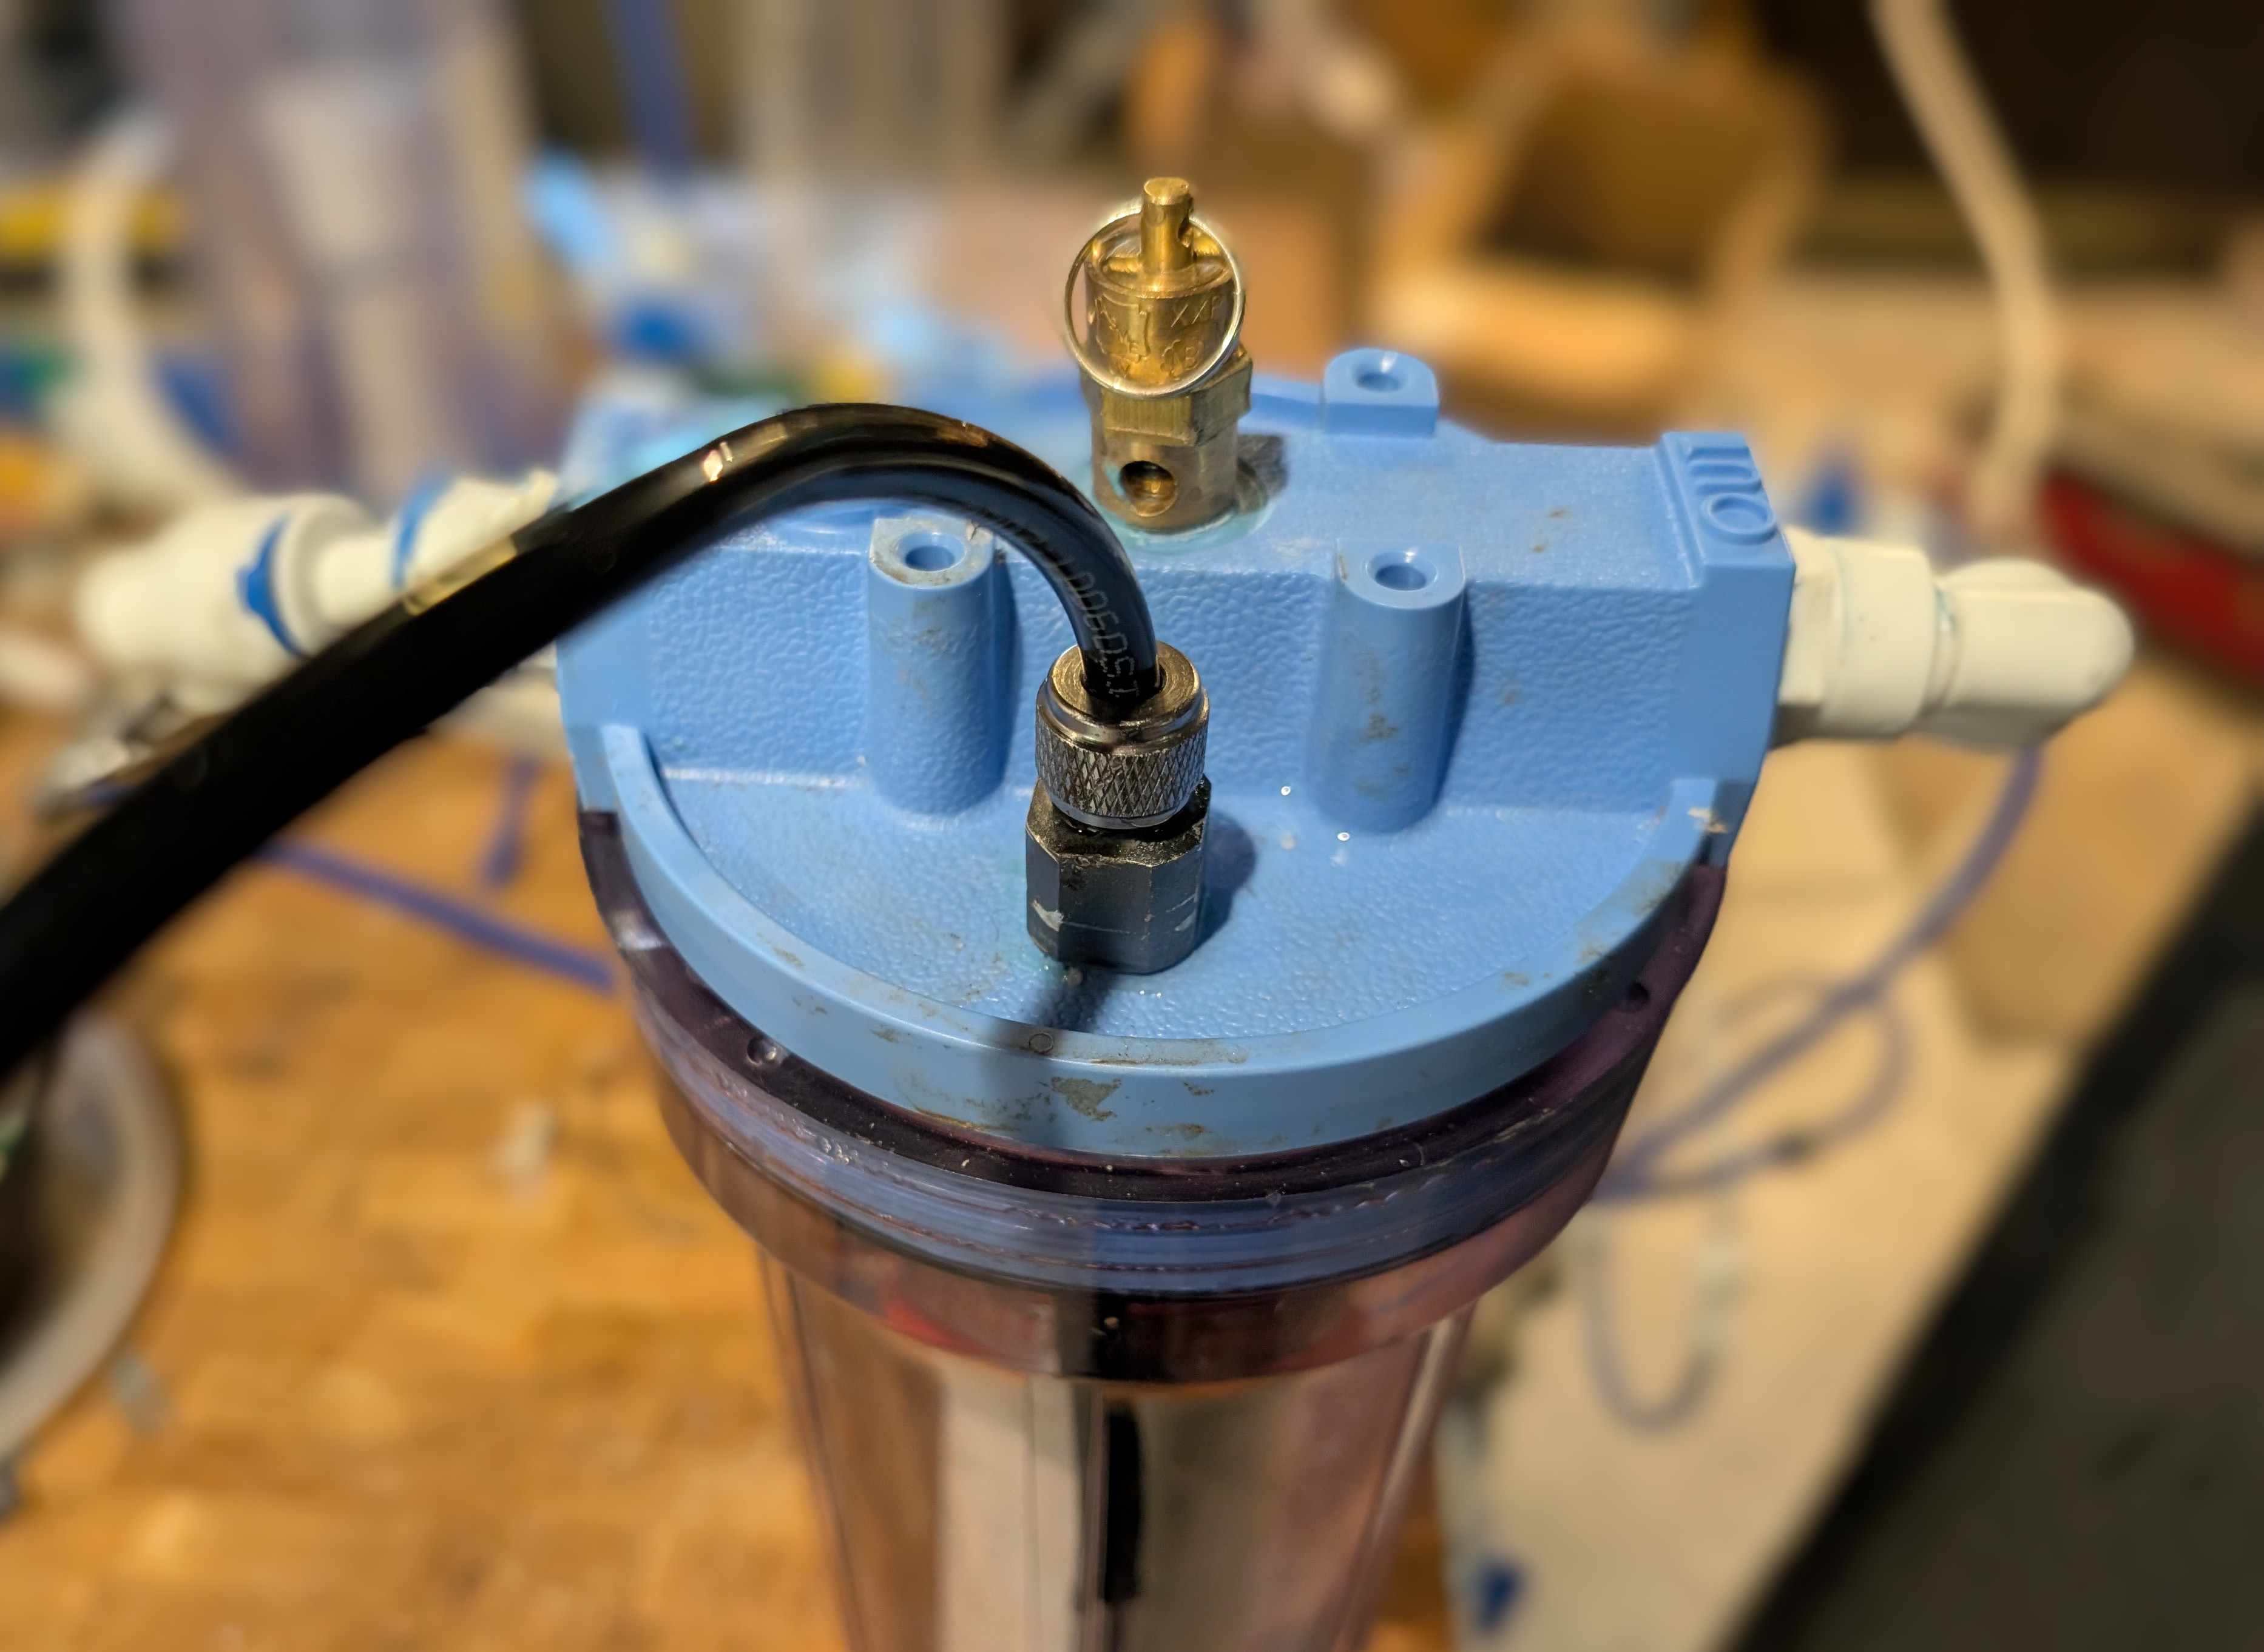
By tapping 1/4" screw holes into the top and having a pump draw water from the aquarium into the reactor, you can create a simple CO2 reactor where water is mixed with CO2 in the canister before flowing back into the aquarium. The solenoid valve controls the flow of CO2 into the reactor, and you can use a bubble counter to monitor the injection rate.
I actually run water in backwards so it's pushed down from the top and bubbles get sucked up the center pipe — this prevents CO2 from building up at the top of the canister and allows for better mixing.
In Krill, I set up two Zigbee nodes, each with a Cron Timer. The timer turns on the CO2 solenoid during the day when the lights are on and plants are photosynthesizing, and turns it off at night to prevent CO2 buildup when plants aren't using it. This is a simple way to automate CO2 injection without any feedback control, but it's a good starting point.
I also have an air stone in the aquarium connected to a regular air pump that runs at night to help off-gas CO2 and prevent buildup while the solenoid is off. It's turned off during the day to avoid off-gassing while the solenoid is on and plants are photosynthesizing.
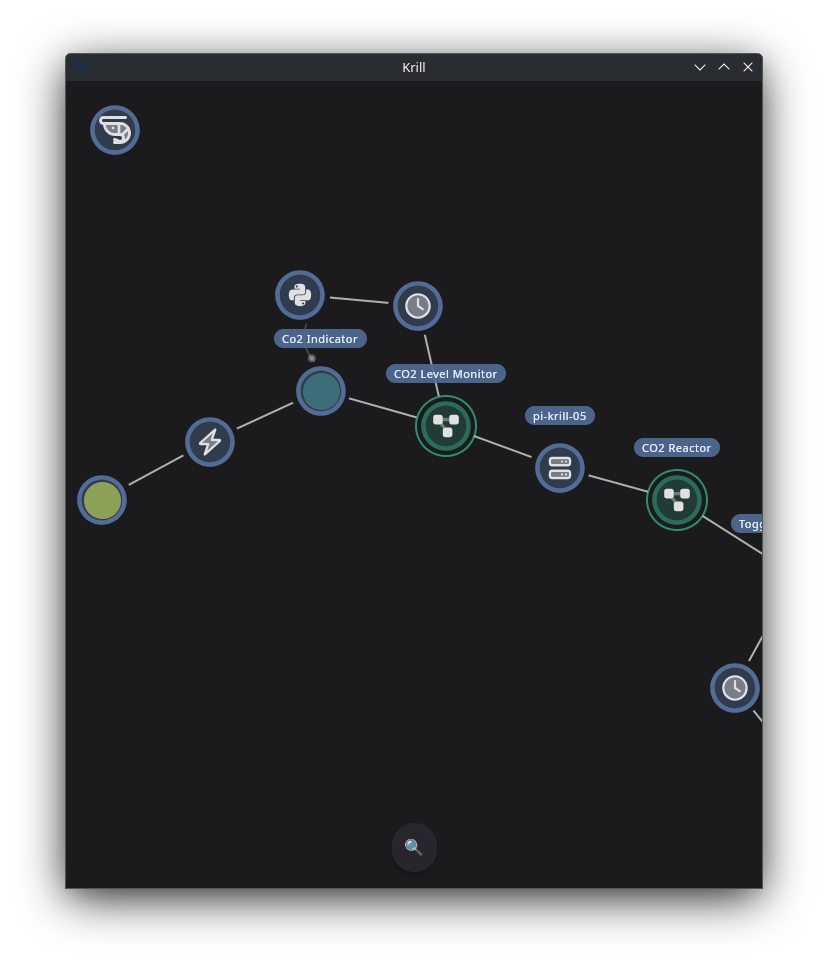
This is what your swarm will look like in the Krill App. This makes great use of Logic Gate Nodes. Let’s unravel how it works:
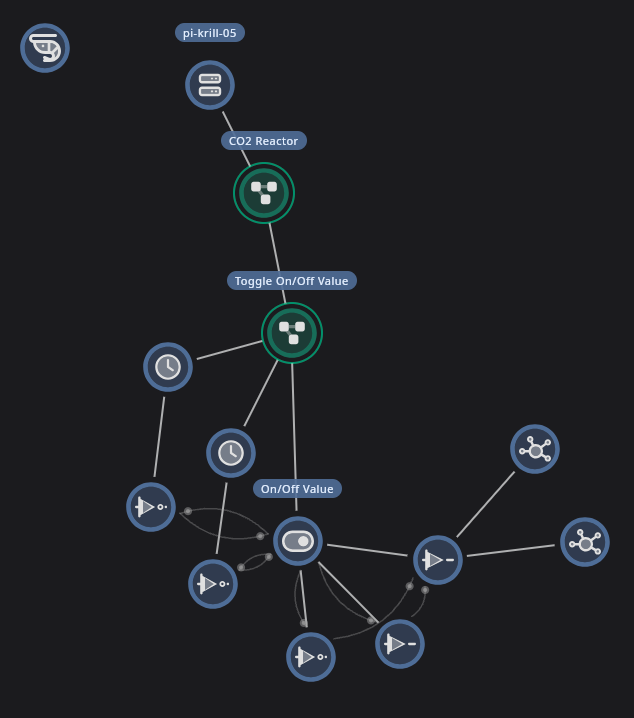
- Two Cron Timer Nodes trigger at sunrise and sunset to turn the CO2 solenoid on and off.
- They each run a
NOTgate that reads the On/Off Value Data Point and writes the opposite. - Another
NOTandBUFFERgate are configured to read the On/Off Value Data Point and both write to aBUFFER. - The
BUFFERreceives a 1 or 0 from the other logic gates and writes that to the Zigbee node controlling the solenoid valve, turning it on or off based on the time of day — and the air pump is set to do the opposite!
Stage 2: Feedback Control with a Color Sensor and Outgassing
Node Types Used:
Hardware Additions:
- A TCS34725 color sensor (or similar) to monitor the color of a pH indicator solution that changes color based on CO2 levels.
- Another RO filter canister.
- An aquarium air pump.
- More RO fittings and tubing.
- A bright white LED + 100 Ω resistor to illuminate the sensor and indicator solution.
- A large-mouth jar.
- A small open-mouth test tube.
- Aquarium CO2 indicator solution from any pet store, or DIY (recipe below):
- Distilled (RO) water, baking soda, 0.04% aqueous Bromothymol Blue — a 100 mL bottle is about $10 USD on Amazon and will last forever.
Building the Outgassing Chamber
As the pump sends water to the CO2 reactor, we also want to monitor the amount of dissolved CO2 in the water. I use an RO T-adapter and a reducer to first reduce the water pressure and flow rate. I also add a pin valve to further reduce the pressure from the pump. Connect this to another tapped hole in the top of the canister.
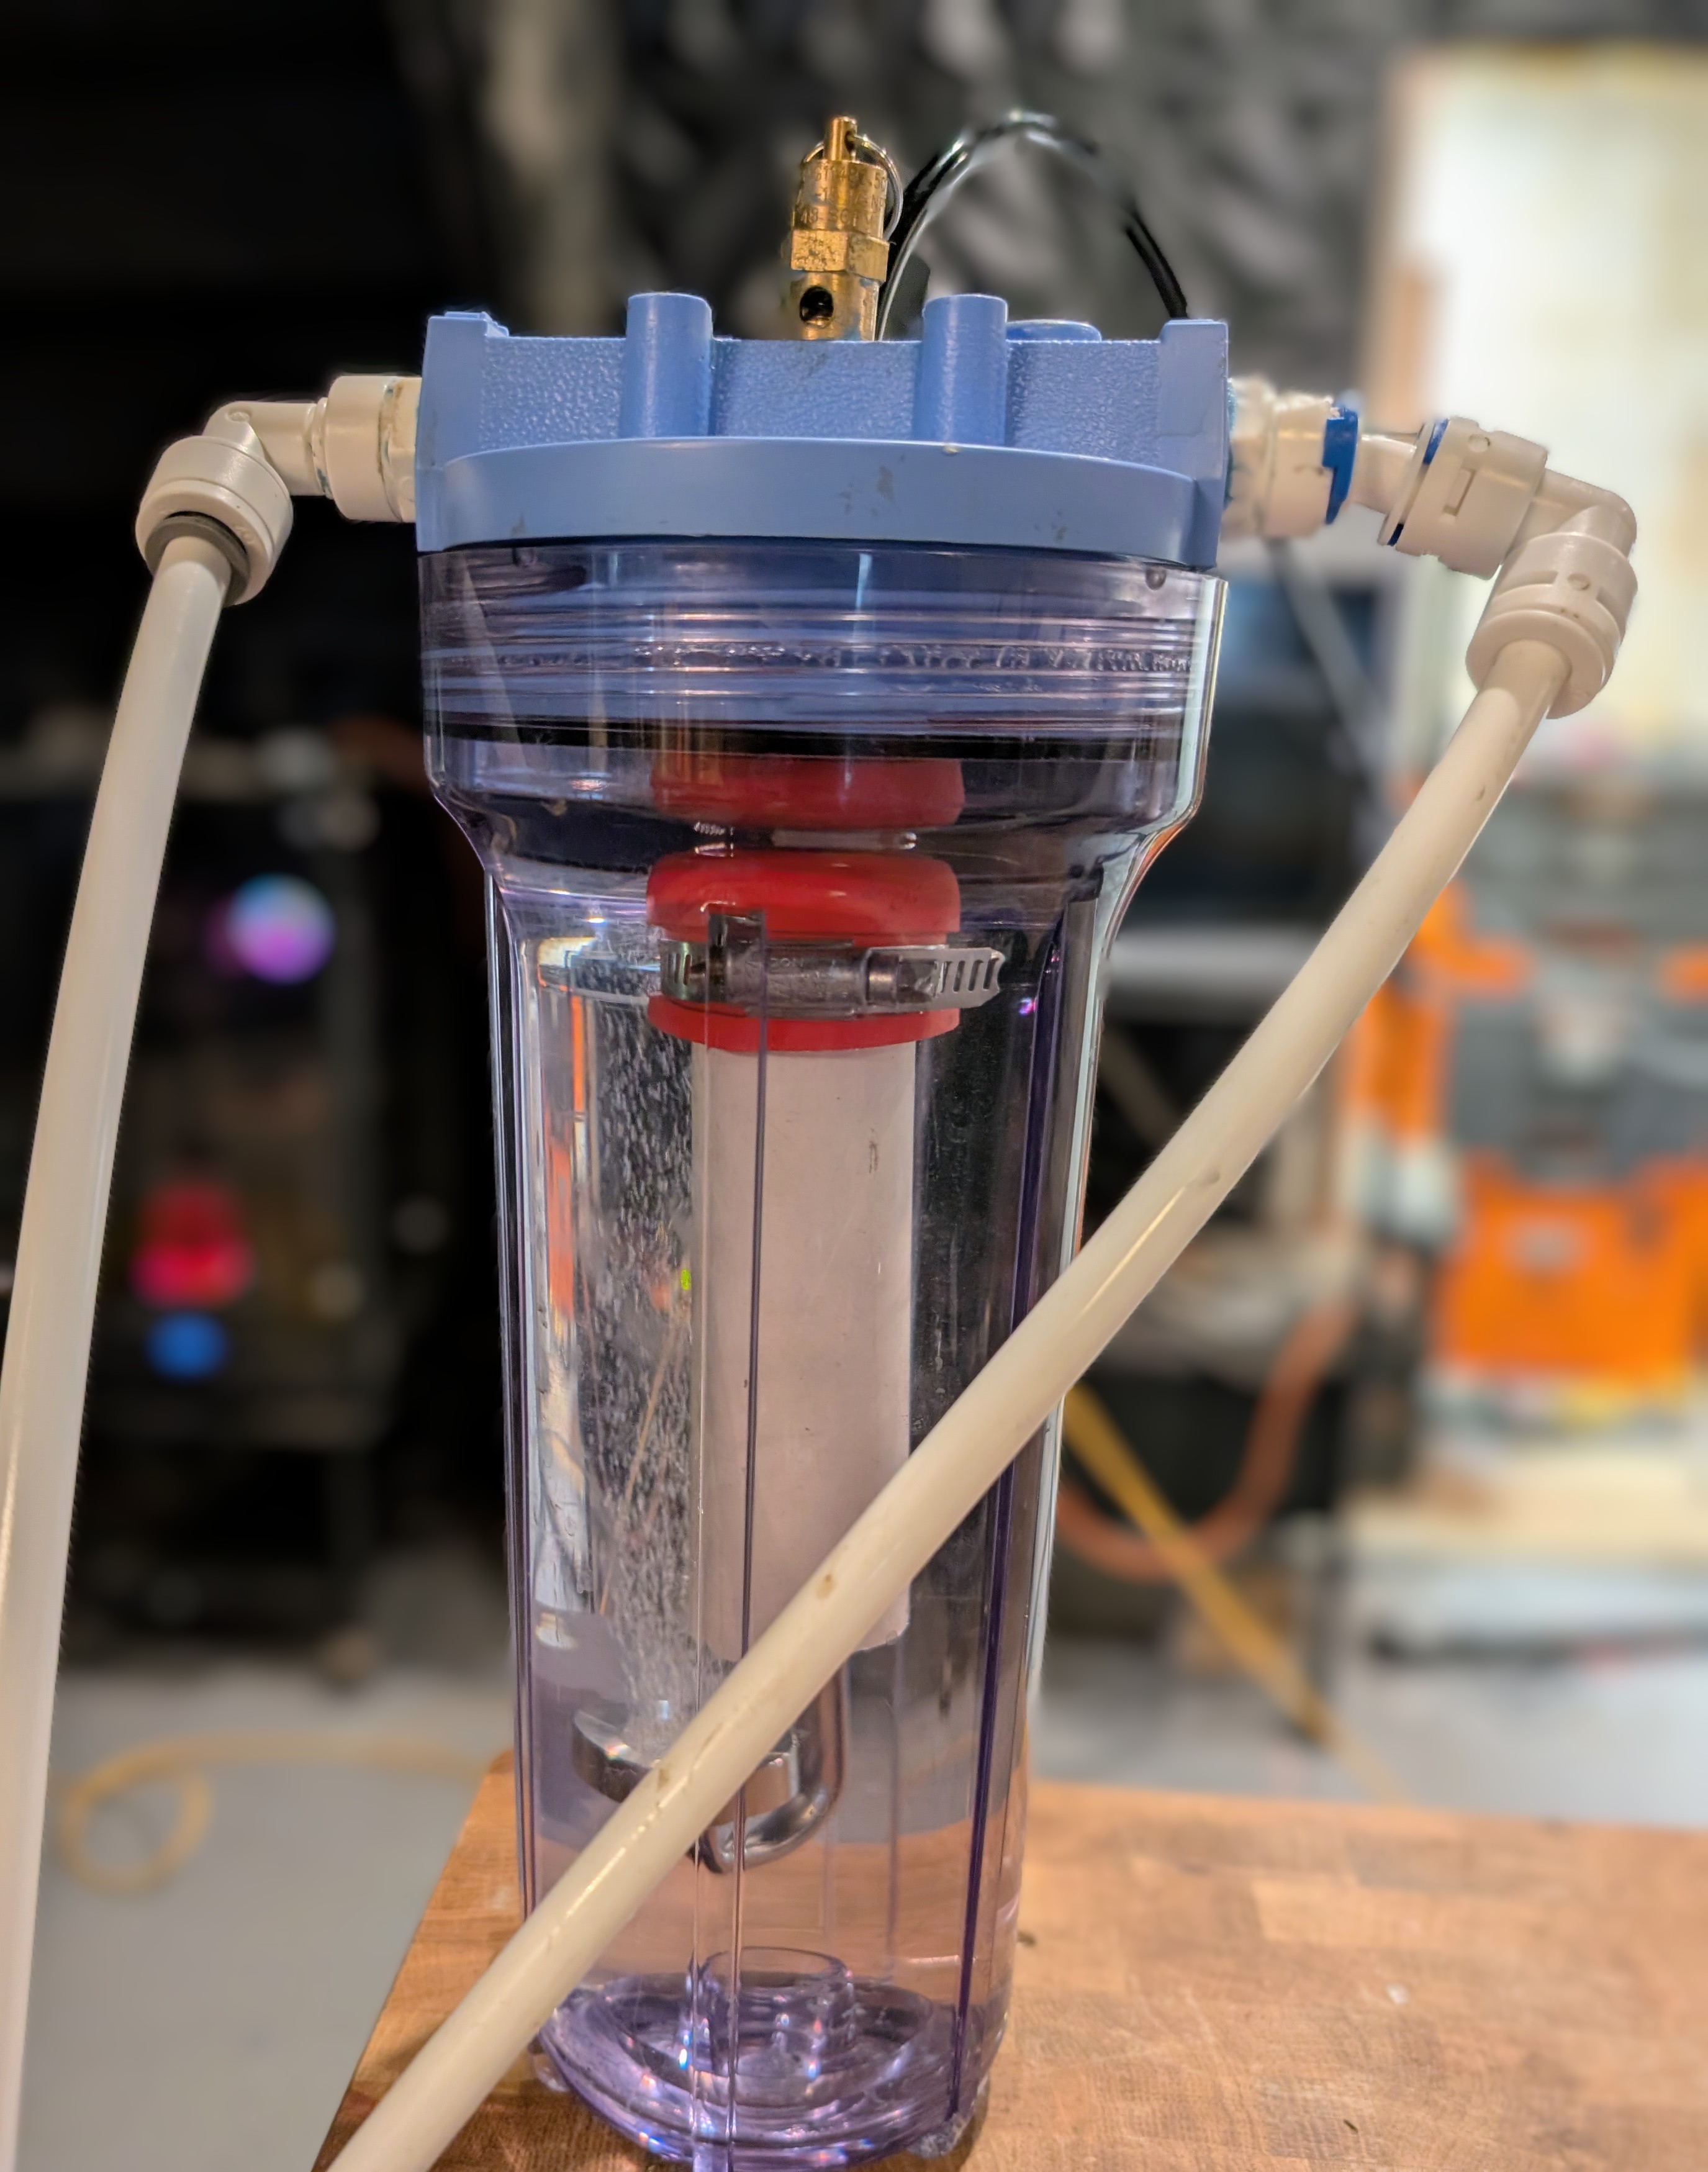
This time, unlike the reactor, we want water to flow in through the input and come out the center pipe, where I used aquarium sealant to attach 5” of 3/4” PVC pipe to the inside center.
Next, I used an RO reducer to connect the aquarium air pump to feed into the water line, so there is now air and water flowing into the canister.
The trick is to have the canister upside down so the PVC acts like a sump. Air pressure builds up in the headspace as it blows in through the aquarium water, allowing it to outgas CO2 into the chamber. It takes some trial and error to get the right balance of water pressure and air pressure, but once you do, you can have a steady flow of CO2-rich air building up in the headspace of the canister as water flows through it.
Then on top is another single tapped hole with 1/4” RO tubing and — importantly — a pressure-reducing pin or ball valve to slow the airflow out. The goal is to have enough pressure from the air pump in the headspace, and weak enough water pressure, that water flows out of the canister and continues on into the system. Small amounts of CO2-rich air from the aquarium water will build up in the headspace and slowly outgas into the next chamber.
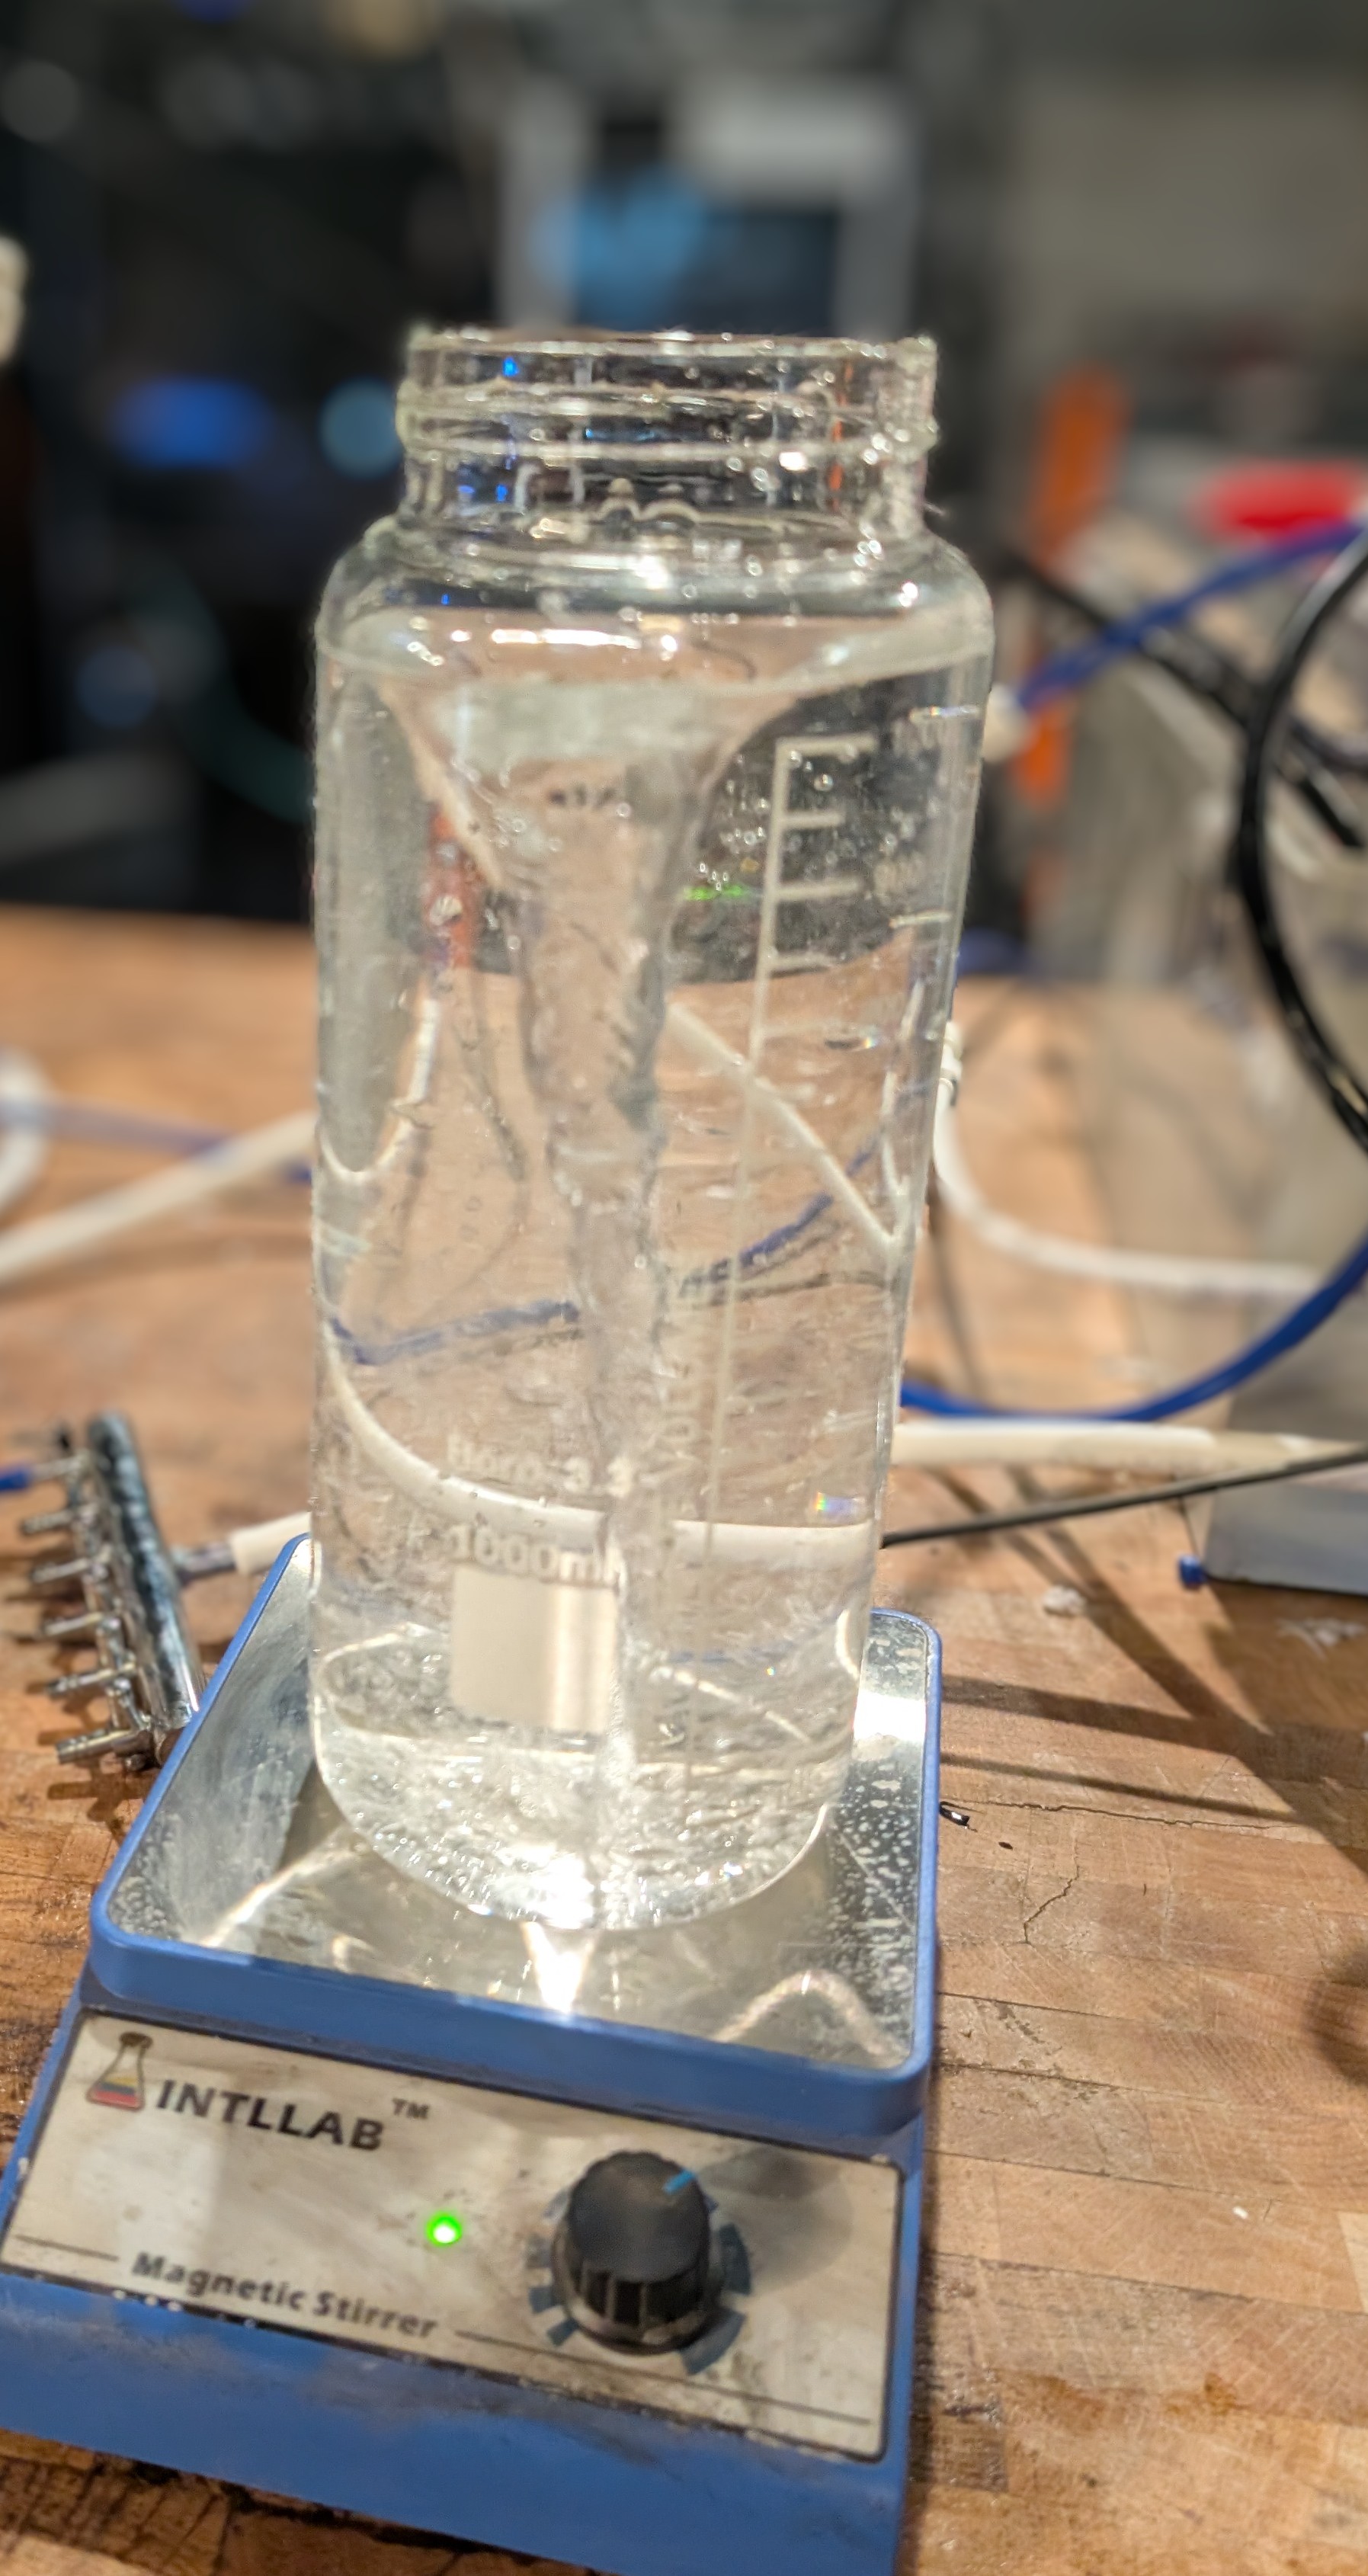
The outgas tube connects to the lid of another chamber to collect gas. Inside that container is the test tube with the pH indicator solution and the TCS34725 color sensor positioned to read the color of the solution. A white LED illuminates the test tube so the sensor can read the color accurately.
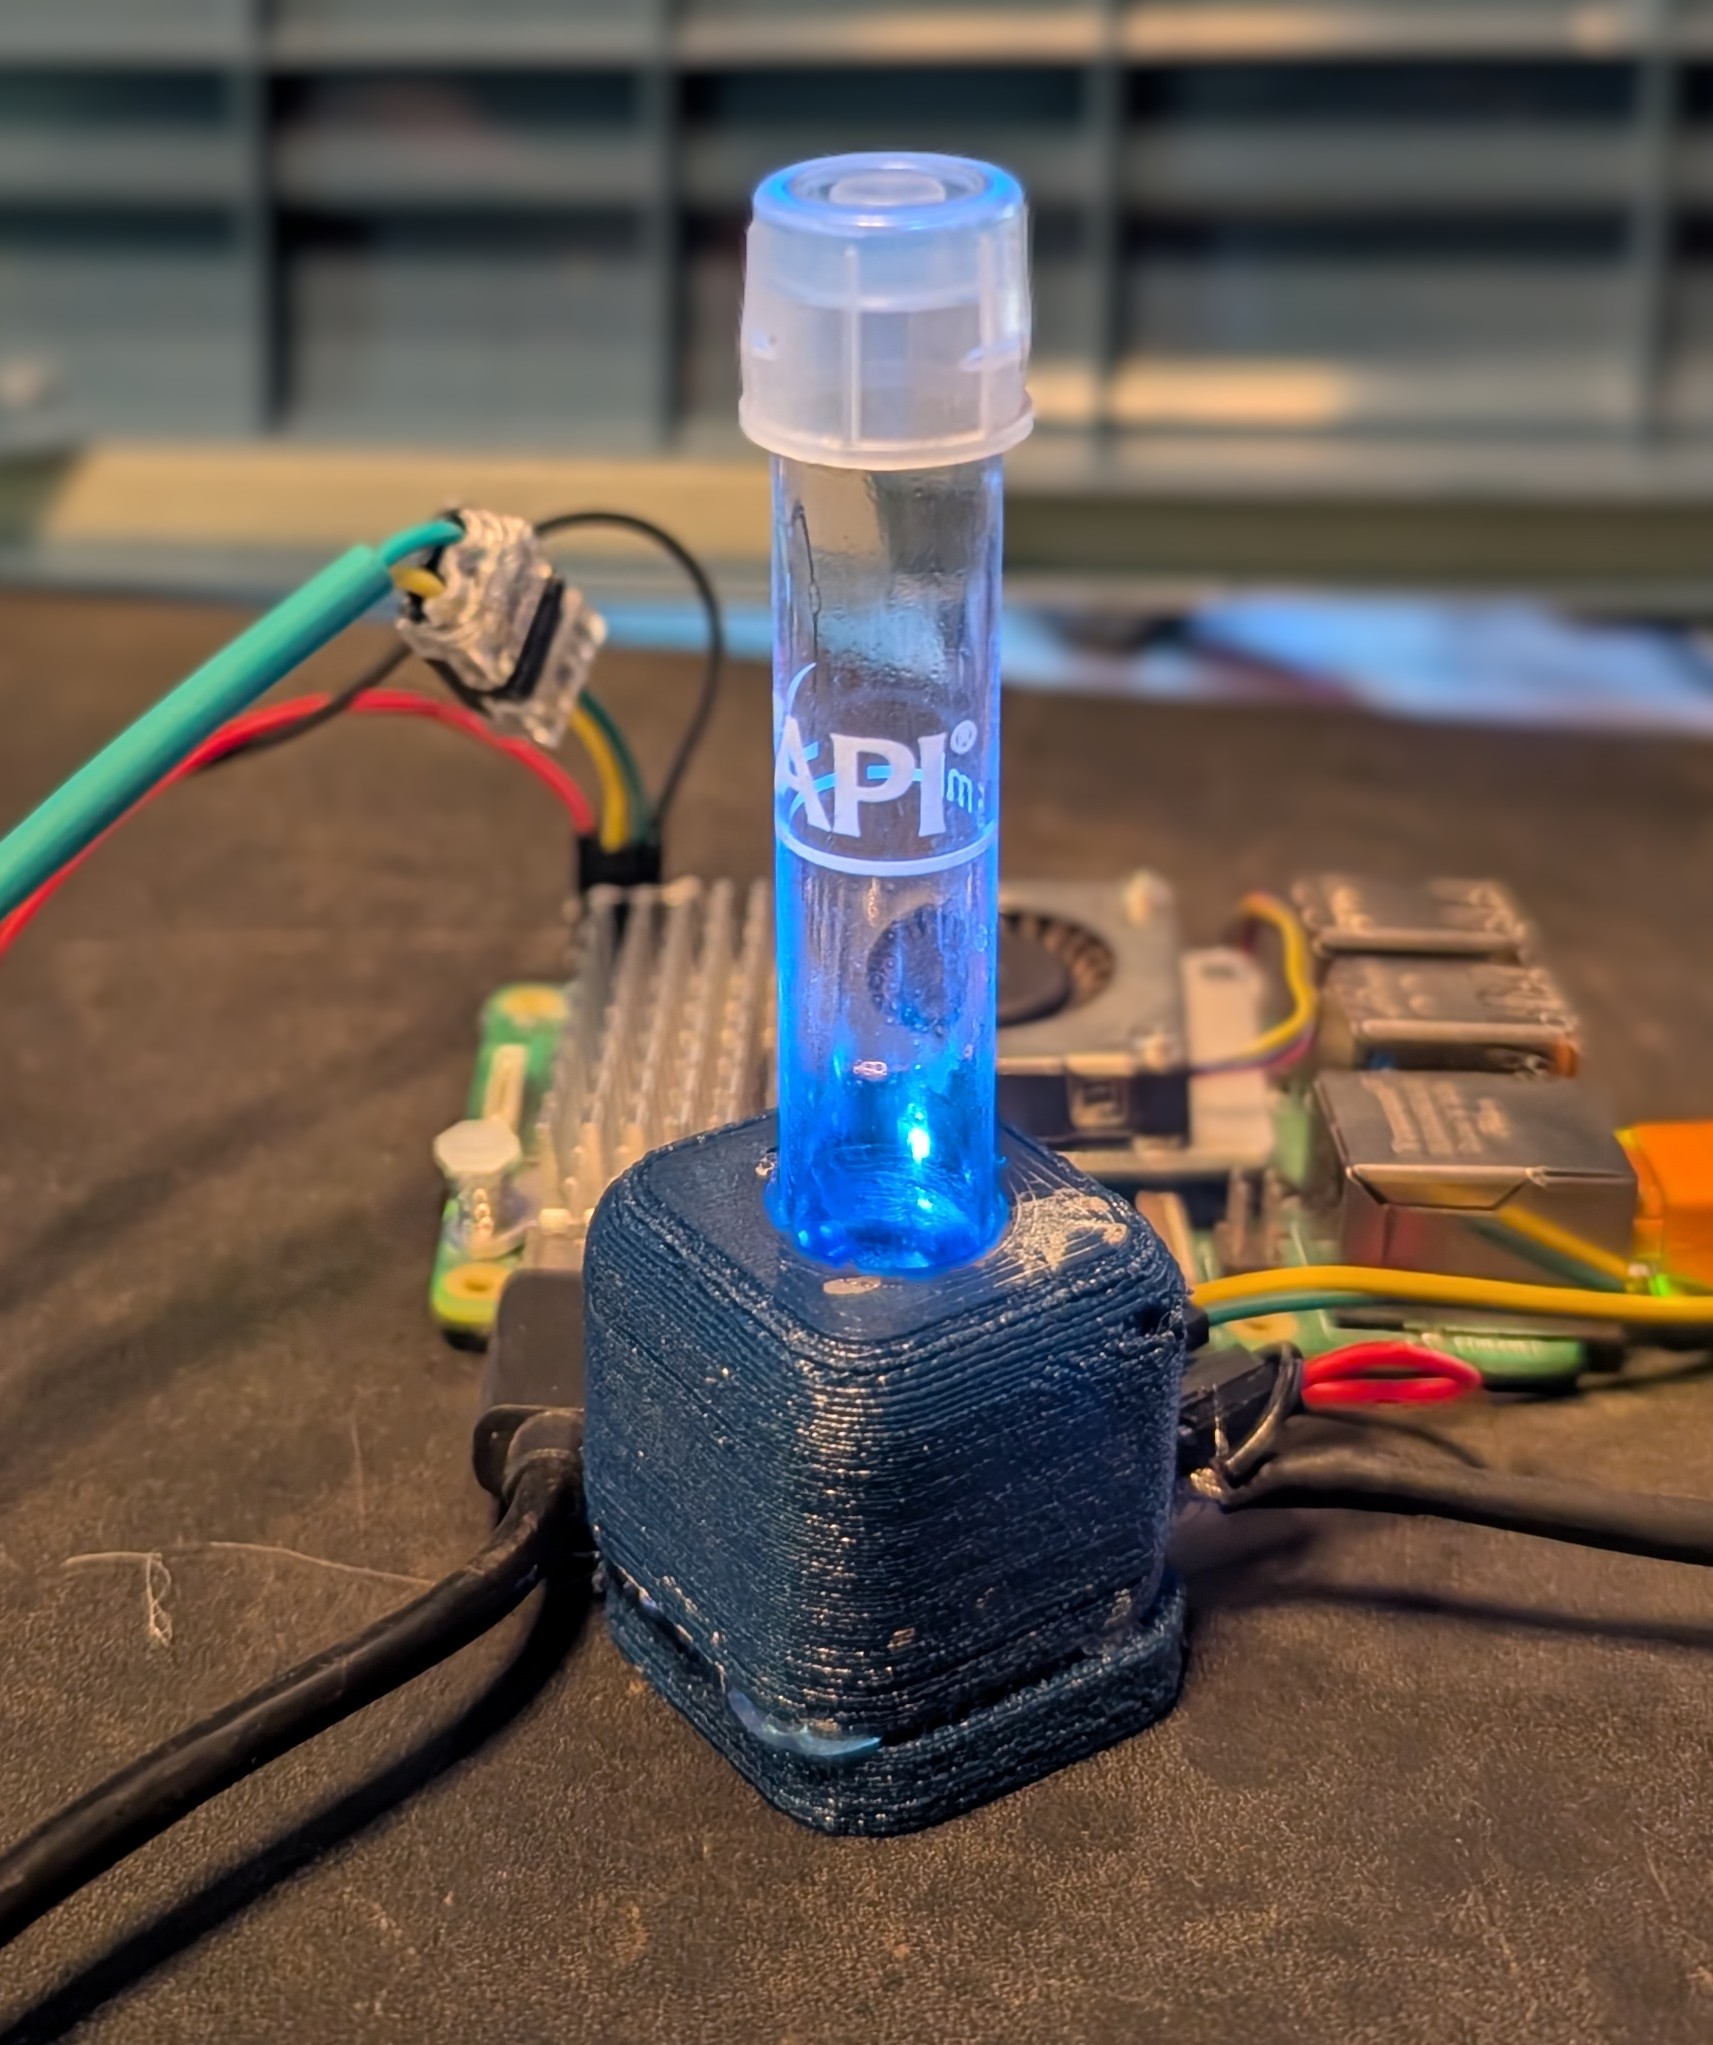
I 3D printed one of these sensor mounts to hold the sensor and LED in place. The sensor reads the color of the solution, which shifts from blue (high pH / low CO2) to yellow-green (low pH / high CO2) as CO2 levels rise.
⚠️ Important: The inside of the chamber must be flat white — colored material will affect the sensor readings! I didn’t have white filament on hand for my 3D printer, so I spray painted the inside of the canister with white matte spray paint to get accurate color readings.
Krill Configuration
Create a new project in your Krill App on the server connected to the sensor. In it we’re going to create:
- A Cron Timer set to run every 30 seconds to read the sensor and update a COLOR Data Point with the current color reading.
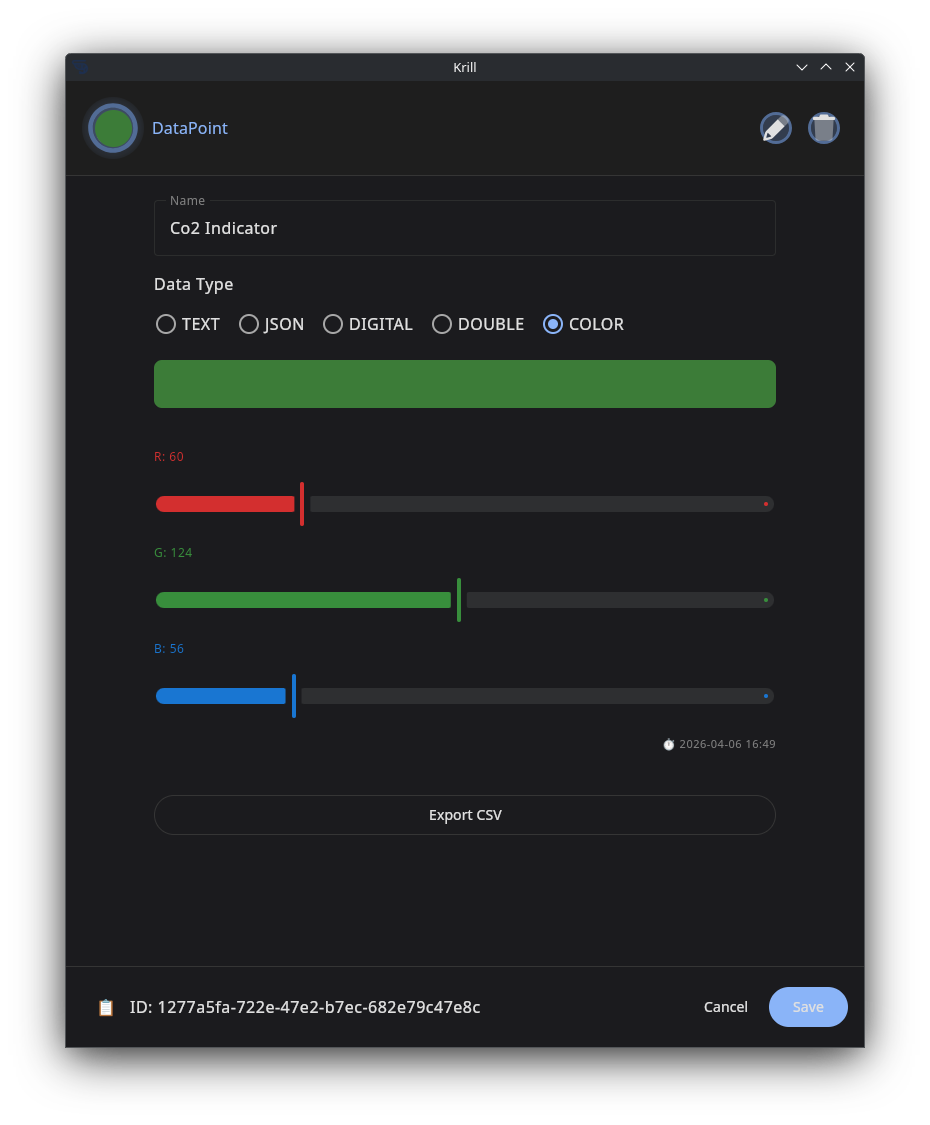
- A Data Point configured with the
COLORdata type to store the sensor reading and show the current color in the swarm view. - A Lambda that runs a CircuitPython script to read the sensor color and print it. The output of the Lambda is written to the COLOR Data Point.
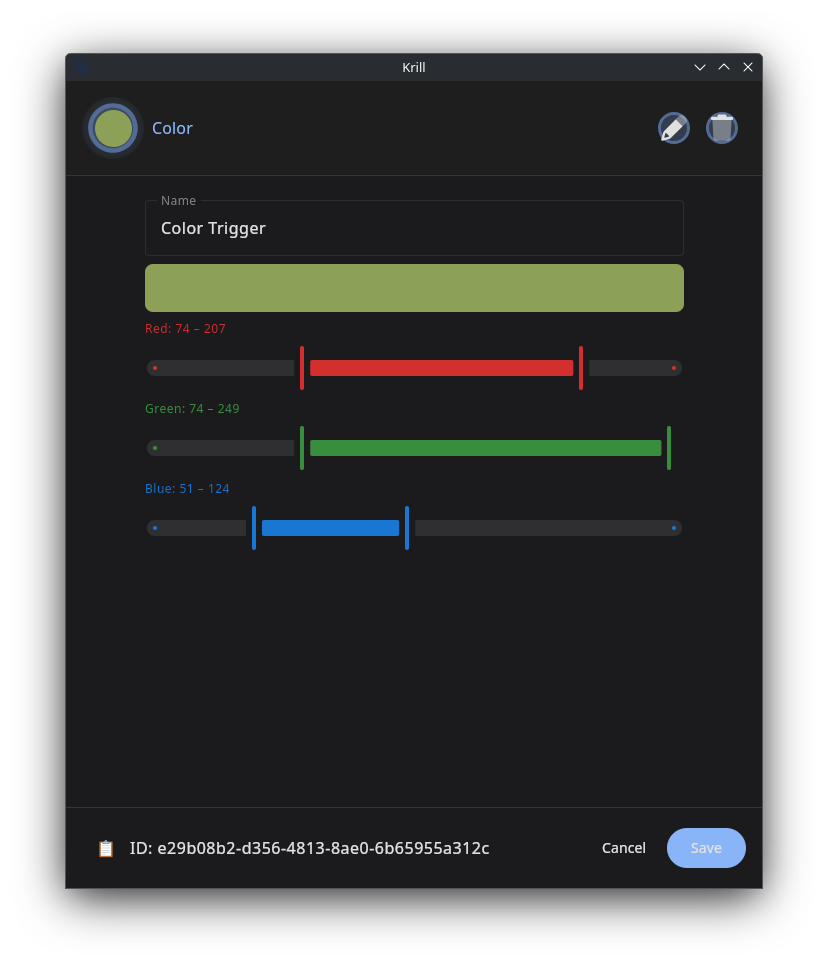
- A Color Trigger that fires when the sensor reading shifts into the yellow-green range, indicating high CO2 levels. This can then trigger an alert or turn off the CO2 solenoid to prevent harm to your fish.
Data Points configured with the COLOR data type show a live color swatch in the swarm view, so you can see at a glance how the color is shifting as CO2 levels change. The Color Trigger lets you set specific RGB ranges to target, so you can automate responses based on the sensor readings.
All you need to do is create a file on your server in /opt/krill/lambdas/ called read_color.py with the following code:
1
2
3
4
5
6
7
8
9
10
import board
import adafruit_tcs34725

i2c = board.I2C()
sensor = adafruit_tcs34725.TCS34725(i2c)

sensor.gain = 4
sensor.integration_time = 100

print(sensor.color)
Advanced users may want to compute the changes in RED and GREEN and convert to a rolling decimal which may be more accurate:
1
2
3
4
5
6
7
8
9
10
11
import board
import adafruit_tcs34725

i2c = board.I2C()
sensor = adafruit_tcs34725.TCS34725(i2c)

sensor.gain = 16
sensor.integration_time = 200

r, g, b, c = sensor.color_raw
print(r / (r + g) if (r + g) > 0 else 0.0)
Save this file and configure a Lambda to run it under the Cron Timer to read the color into your Data Point. For the advanced script, set the data type to DOUBLE and use a High Threshold Trigger instead, since the output is a decimal value rather than a color. The first script can be used alongside it to display the live color swatch.
Color Triggers fire when a COLOR node’s value enters a defined range:
Any trigger in Krill can be configured to fire an executor — from controlling sensors, to sending an email alert, to calling an outgoing webhook. The next step is up to you! You could set up a Lambda to send a text message or a webhook to trigger something in another system. The possibilities are endless.
You can also view color changes over time and add them to your SVG dashboards or data charts for a visual history of how your CO2 levels are fluctuating:
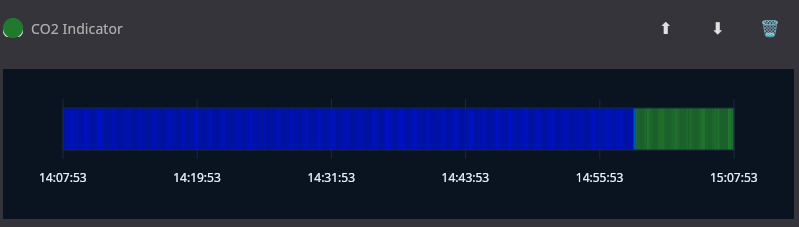
(This was a rather dramatic example during testing when I forced pure CO2 into the chamber to see the color shift!)
Making DIY CO2 Indicator Solution
If you want to make your own CO2 indicator solution, you can easily do so with distilled water, baking soda, and a pH indicator like Bromothymol Blue. The measurements are so small that it’s best to make a concentrated stock solution that you can dilute as needed. Here’s a simple recipe:
I use water from my RO drinking water system but tap the line before it goes through the re-mineralization filter, so minerals aren’t re-added. Distilled water works fine too — just make sure it’s pure and doesn’t have any additives.
- Start with 1000 mL of distilled (RO) water.
- Add 1.2 grams of baking soda (sodium bicarbonate) to the water and stir until fully dissolved.
- Then add 100 mL of the solution you just created to another 900 mL of distilled water to create a 10% stock solution. This will give you a solution with a pH around 7.6 and 4 dKH, which is a good starting point for a CO2 indicator.
- Add 0.04% aqueous Bromothymol Blue to the stock solution. This means adding 0.04 grams of Bromothymol Blue to every 100 mL of your stock solution. That’s a very small amount, so it’s best to use a precise scale or make a more concentrated stock of the indicator and dilute it.
When learning this, it’s a good idea to get an off-the-shelf indicator and compare the color changes side by side with your DIY solution to make sure it’s working correctly. You can also experiment with different concentrations of baking soda to see how it affects the color change and sensitivity of the indicator.
Related Guides
- Getting Started with Krill — Install Krill and create your first project.
- Zigbee and MQTT Integration — Set up Zigbee2MQTT on your Raspberry Pi.
- CircuitPython Sensors via Lambda — Read I2C sensors directly on the Pi.
- Color Data Points and Triggers — Deep dive into the COLOR data type.
- Relays and Solenoids — Controlling water flow with GPIO pins.
- Leak Detection with Logic Gates — Safety automation for water systems.
- SMTP Email Alerts — Get notified when triggers fire.
- Kiosk Mode — Turn your Raspberry Pi into a touchscreen dashboard.
- Project Dashboard — Live data, video, and automation at a glance.
- Data Charts and Graphs — Visualize data points with customizable charts.
- High Threshold Trigger — Trigger workflows when values exceed a threshold.
Last verified: 2026-04-08