Turn A Raspberry Pi Into A Kiosk With Custom SVG Dashboards
Install Krill Server in Kiosk Mode for Touchscreens
Creating A Kiosk With Custom SVG Dashboards
If you install Krill Server on a Raspberry Pi, you can turn the Pi into a dedicated display with an HDMI monitor.
Kiosk mode supports touchscreens and you can pan and zoom.
🦐🦐🦐 WARNING: This will take over the Pi and you won’t be able to use it for anything else. You can still access the Pi via SSH but the display will be dedicated to the Krill App.
- Flash an SD Card for the Pi with Raspberry Pi OS Lite (without desktop). It’s important you don’t install a desktop environment because the Krill App will be the only thing running on the display.
- Install Krill Server
- Run
sudo krill_kiosk_install.sh - Note this script is a beast! It will setup your to boot into kiosk mode with the chromium browser in full screen and it will also install the Krill App and set it to open on boot. It will also setup a systemd service to run the kiosk mode on boot. It will also disable the screensaver and power management to prevent the display from turning off.
- Reboot your Pi and you should see the Krill App on the display. You can then connect to the app from another device and start creating your custom SVG dashboards!
Uninstalling Kiosk Mode
sudo krill_kiosk_install.sh --uninstall- To remove the user:
sudo userdel -r kiosk - To remove packages:
sudo apt remove cage chromium seatd xserver-xorg xinit
Overview
The main screen of a krill app is meant for large form factores like an overhead display of a factory floor or a TV. I like to keep my lab on a tablet on my desk to observe various experiments and see problems and alerts.
When your swarm gets complex, with a lot of servers and nodes it can be hard to see what’s going on but easy to see when there is an error or alert.
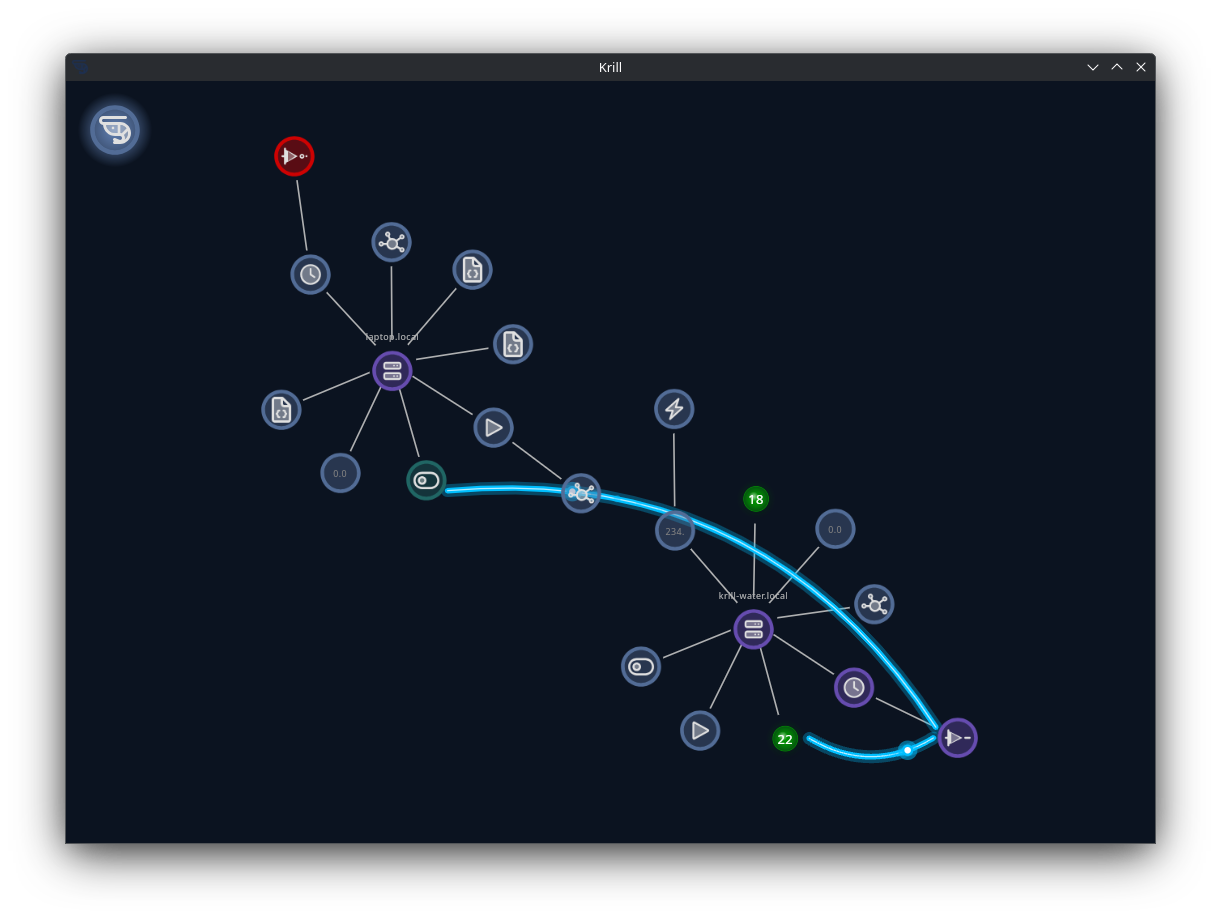
You can create SVG diagrams to visualize your swarm’s processes and data in a way that makes sense to you and use the Krill App to overlay your data to create real-time visualizations.
InkScape is a free and open-source vector graphics editor that can be used to create SVG diagrams. You can use it to design your process control diagrams and then export them as SVG files. That’s what we use!
To add a diagram to krill, connect to a Krill Server and create a project and then add a diagram node.
In the diagram node, you can specify the URL of your SVG file and then bind your data points to the elements in the SVG.
The trick is to create transparent rectangles with an id prefixed with k_ in your SVG file. These will be the anchor points that you can bind to anything in Krill.
There’s no limit to what you can add, even embed other diagrams inside your diagram! You can create a diagram of your factory floor and then embed a diagram of a machine inside it.
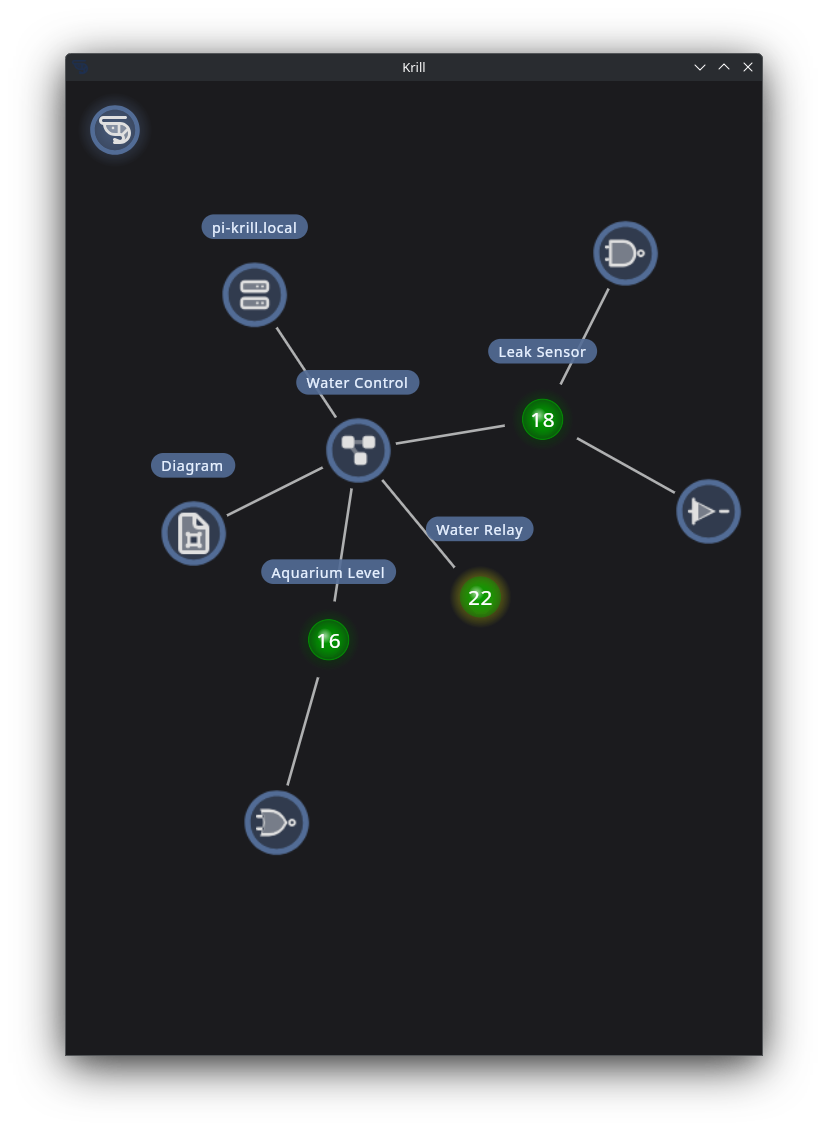
In this simple example of a Raspberry Pi with a two water sensors and a relay to control a soleniod to turn on water, a simple diagram can be created to visualize the state of the sensors and the relay turning this:
Into this:
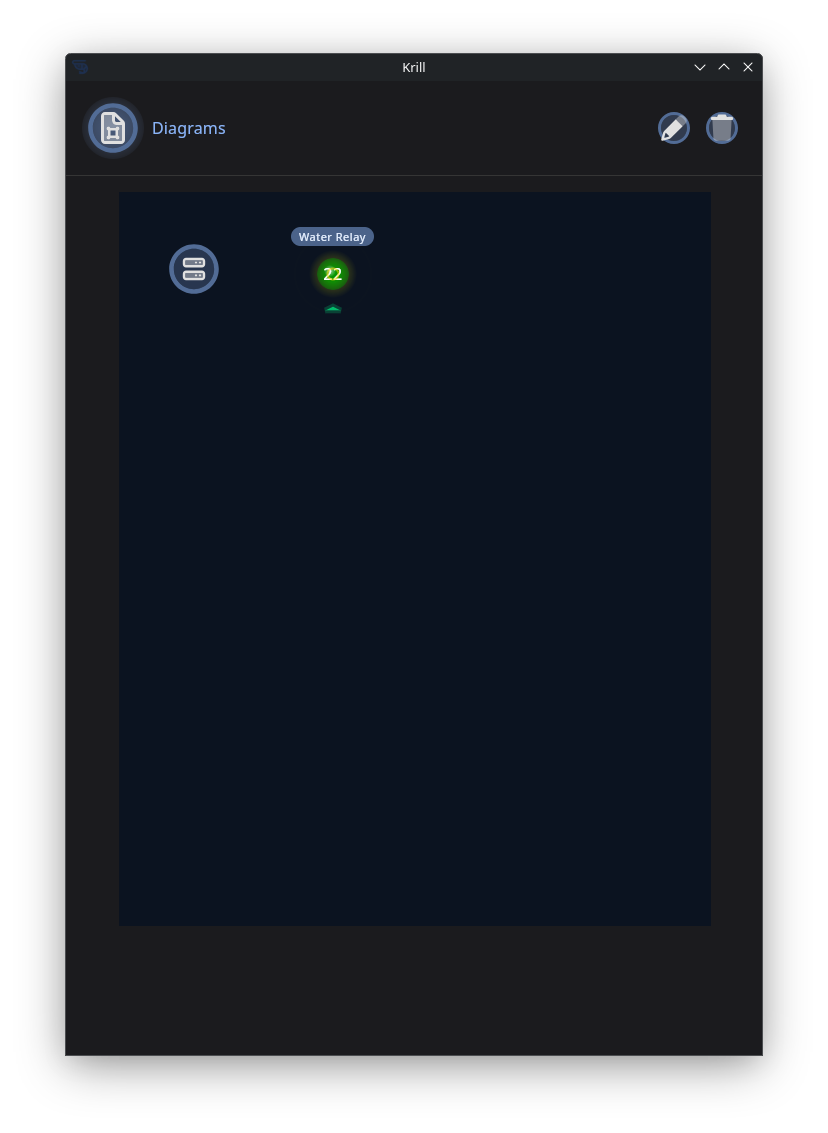
Just with this!
1
2
3
4
5
6
7
8
9
10
11
12
13
14
15
16
<rect
       style="fill:none;stroke-width:1.53635;stroke-opacity:0.545833"
       id="k_server"
       width="30"
       height="30"
       x="10"
       y="10" />
<rect
       style="fill:none;stroke-width:1.53635;stroke-opacity:0.545833"
       id="k_pin22"
       width="30"
       height="30"
       x="55"
       y="10"
       inkscape:transform-center-x="-39.908471"
       inkscape:transform-center-y="36.727361" />
You can upload SVG files to a Krill Server or keep them anywhere your app can access and see changes automatically when files are modified.